What is the most common marketing mistake startups make?
There can be many answers that come to mind: not allocating enough budget to marketing activities; neglecting marketing altogether believing that the product will speak for itself; misconstruing your target audience. Most startups have very little resources, both financial and human, and have to find ways to adapt to that.
Fortunately, nowadays every founder realizes the importance of marketing so most of these mistakes are fairly rare. However, there is still something many startups neglect– and it’s analytics.
Even though oftentimes startup marketers have a clear goal and passion for their company, which certainly helps to achieve it, they are not examining the paths they take to this goal.
The truth is, passion and the most brilliant marketing ideas are not enough if you don’t have data to support them. That’s why analytics are vital to your success – they support your marketing ideas, help to examine what you’ve achieved, and show you how to move forward.
Startups oftentimes struggle with consistently tracking their analytics. Here are the reasons why:
- When you are just starting out, it may seem like there’s not much to track: you have few customers, a handful of followers on social media, and modest website traffic. However, even small numbers are important. Besides, establishing an analytics routine early on helps to create a habit that will be relevant in the future.
- Many startups don’t have enough human resources to build a proper marketing department. Thus, there are only a couple of people who are executing all the marketing activities. It’s only logical that they can lack experience in certain areas and these areas are left under-analyzed.
- There are many cookie-cutter models for marketing analysis that are best for traditional businesses and may not suit a startup. So logically, when you try to apply them to your company, you only get discouraged.
In this article, you will find 11 essential marketing metrics divided into four groups: website performance, social media marketing, media visibility, and business impact. You can customize the list based on your needs by prioritizing certain metrics and discarding irrelevant ones.
Website Performance
For startups, the website is usually their main business platform. Here they showcase their product, get leads, and close sales. That’s why the website performance metrics should be on the top of your analytics list.
1. Website Traffic
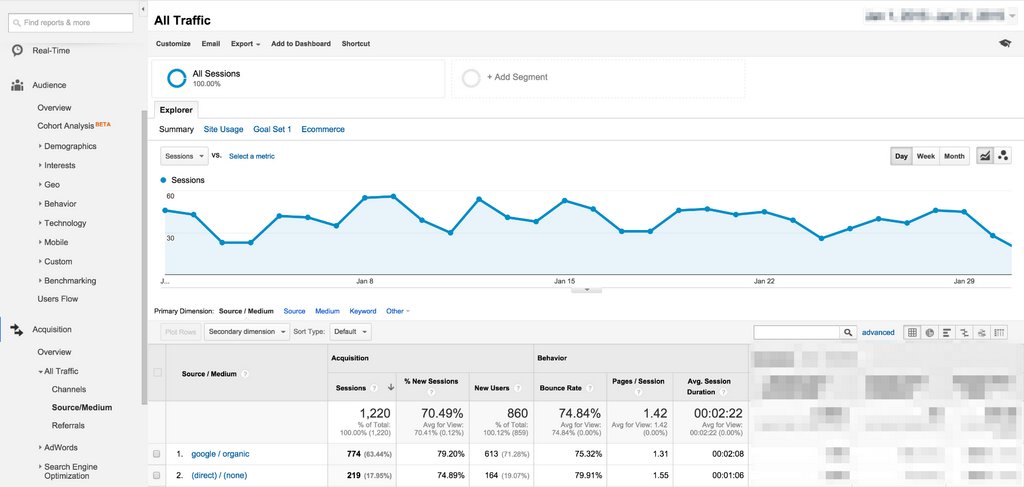
The most obvious metric to follow is traffic. It includes the number of people visiting your website, where they are from, and how they come across your website.
All in all, web traffic is one of the most comprehensive metrics since it includes many small ones. Your main tool here is Google Analytics. It’s able to tell you:
- who your audience is,
- how they find you,
- what pages on your website generate the most traffic,
- and what pages users visit before making a buying decision.
In Google Analytics, go to Audience – Overview. That way you’ll be able to see the amount of traffic you get and where it comes from (countries, search engines, browsers, and more).
One of the main things to keep track of is the type of traffic you get. Google Analytics divides traffic into:
- Direct (people who put your URL in the browser and go to your website)
- Organic search (people who come across your website while Googling something)
- Referral (visits from other websites)
- Social (traffic from social media)
- Paid search (your ads)
- and Other (when the source of the traffic is unclear)
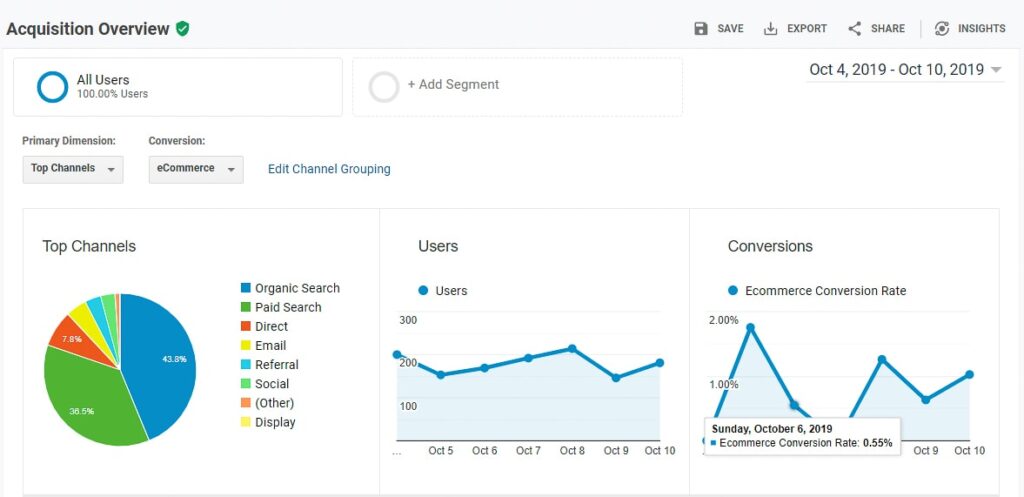
Your whole marketing strategy depends on these metrics. They can tell you whether you should push for more organic traffic through content marketing or invest in online ads, or amp up your social media.
Behavior – Site Content tells you what pages are visited the most i.e. your landing pages. These are the most important pages on your website since they are the reason users enter it in the first place.
Chances are your landing pages will contain ranked keywords which influence your positions in search engines – more on them in the next paragraph.
2. Keyword Ranking
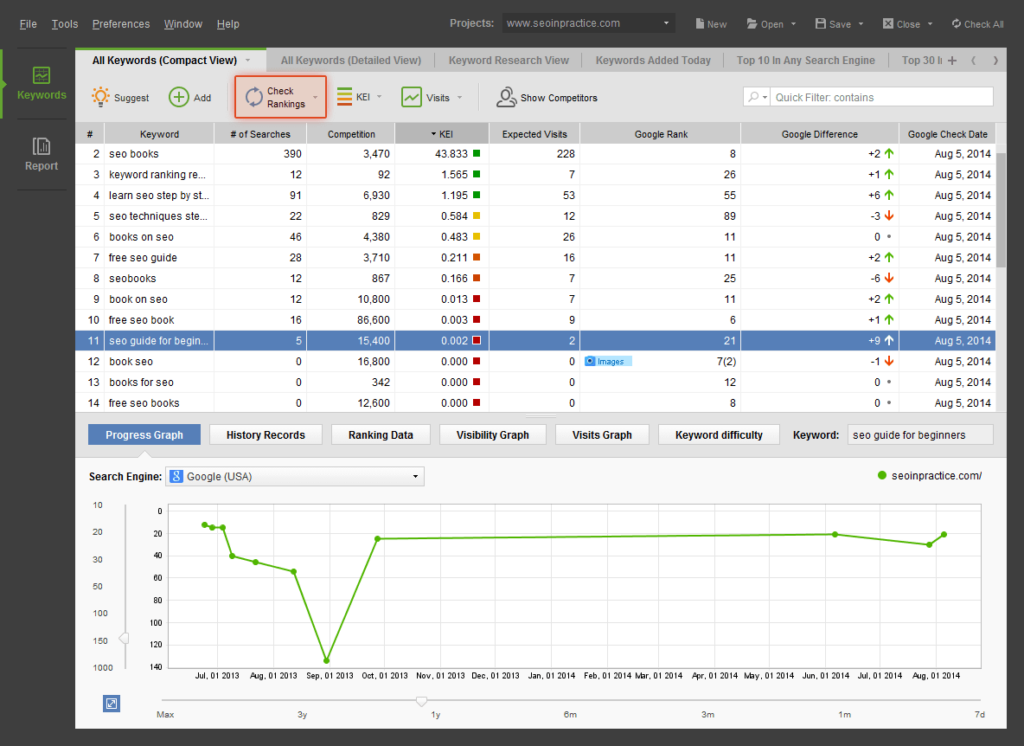
No matter how SEO-savvy you are, you probably know that keyword ranking is one of the most important metrics for your website. It shows where your pages show up in search engines, when, and for which search intents.
I think there’s no need to explain why keyword ranking is important to track. The ranked keywords ensure your pages are shown when a user searches for a relevant product or topic in search engines, so by tracking them you are tracking your website traffic as a byproduct.
This metric shows you how well your website fits with the search intent that may lead to a buying decision.
You can use RankTracker from SEO PowerSuit to track all your keywords, see how their ranking changes with time, and find new unexpected keywords that bring your traffic.
3. Conversion Rate
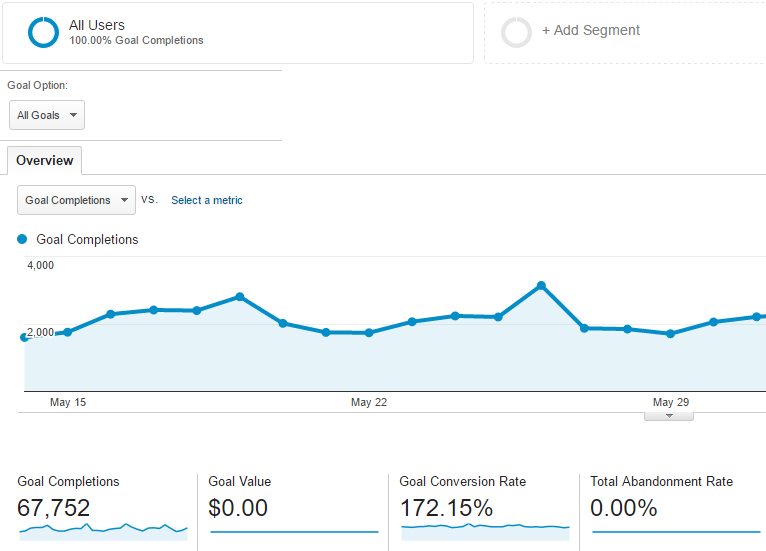
Conversion is the logical goal of any business – in the end, you want people to purchase your product, sign up for your service or reach out for a demo. The conversion rate as a metric shows the ratio between people visiting your website and buying your product.
You can find this data by checking Google Analytics’ Conversion tab where you can check your conversion rate.
For marketers, this metric can be useful to identify whether your’s using the right tactics at the second stage of the sales funnel. If you have large traffic and a decent number of leads, but a low conversion rate, it may indicate that:
- You fail to explain the value of your product to the audience
- Your marketing offer lacks some necessary features (low price, customer support, and so on)
- Your content strategy generates a lot of irrelevant traffic, people are randomly clicking your pages without relevant buying intent
Social Media Marketing
In 2022, it’s a given that your company should be present at least on one social media platform. Truthfully, it should be present on all the platforms where your audience hangs out, and even though they differ in functionalities and mechanics, these metrics will be relevant for each of them.
4. Social Media Mentions

Social media mentions are the sure way to get more attention and raise brand awareness – something every startup needs.
You can track your number of social media mentions with a social media monitoring tool like Awario or Talkwalker. These tools show how the number of brand mentions changes (and hopefully grows) over time, where they come from, and who are the authors behind these mentions.
It answers questions such as:
- How many people talk about your brand?
- Where do they talk about it?
- Which countries, states, cities?
- Who are these people (their age, gender, etc)?
All of this information is updated in real-time through a social media monitoring tool. The changes and trends in the volume of conversation show which particular events have an impact on your startup’s brand awareness: holidays, viral posts, new launches, interviews with founders, and so on.
5. Reach

Reach is another metric that relates to brand awareness and it represents how many people saw your brand name.
While each social media platform reports on the reach of your account and posts, I also recommend adding reach from your mentions to your analytics. While the number of mentions shows you how many times people talked about your startup, social media reach shows how many people saw these conversations.
Add the reach number available in the native social media analytics (Twitter’s Impressions, Instagram Reach) and social listening reach, and you’ll see how many people your brand has actually reached in the given period of time.
6. Social Media Shares
What do you do when you came across a relatable, funny, or thought-provoking post online? You share it of course.
Share is the best indicator of your content’s value since people are deeming these posts the ones that are worthy of their followers’ attention. This can be counted as retweets, reposts, shares to Stories, or duets and stitches if we are talking about TikTok.
Shares also help you raise brand awareness and bring your content to your audience. So it’s important to track how often and why your content is shared, to avoid content mistakes and repeat success in the future.
7. Engagement Rate
The engagement rate is a metric often used to track how actively involved with your content your audience is and how effective your brand campaigns are. Engaged consumers interact with brands through interactions such as likes, comments, and social shares.
Engagement essentially boils down to how much audience accounts are interacting with your account and how often. High engagement rates will indicate audiences’ interest in your content.
Media Visibility
Another important channel for startups is media: be it industry news platforms, reviews, or interviews in niche media. Here are the metrics that help you analyze this channel.
8. Share of Voice
Share of voice allows you to track your media visibility benchmarked against your competitors. Basically, it shows you how often your startup gets mentioned in the media, and how many views these articles get in comparison to other brands in your niche.
In other words, SOV shows you what part of your niche media you take up.
Social listening tools typically offer this analysis, for example, Awario shows this metric in its Alert Comparison report.
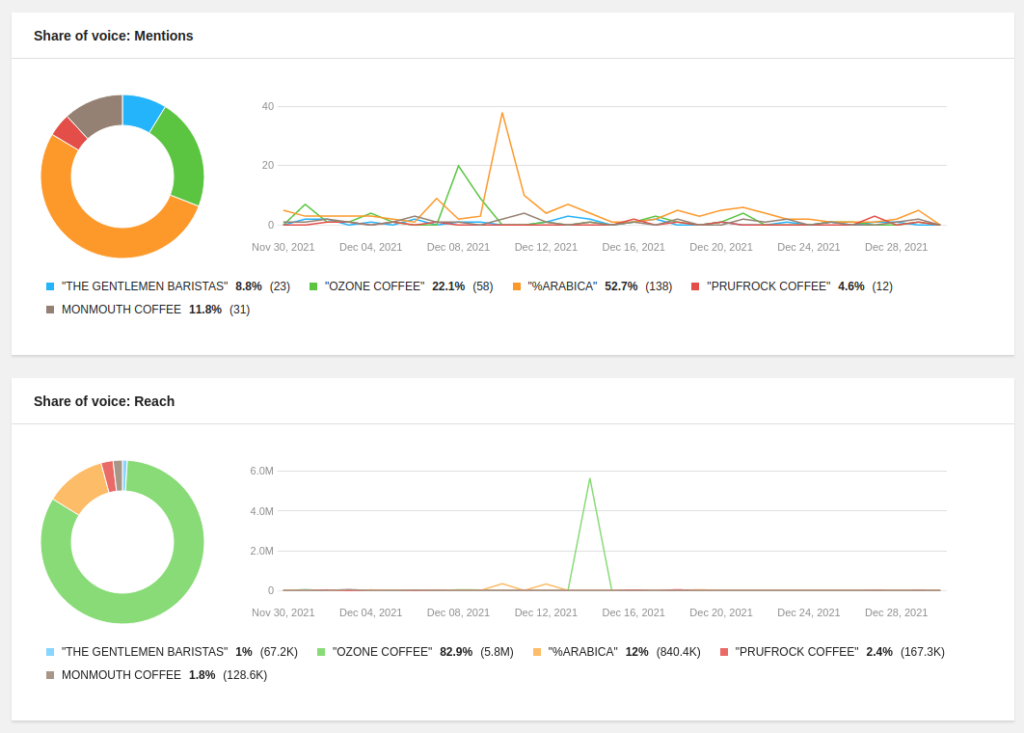
This metric doesn’t just show you how your brand awareness is changing – and hopefully growing – but it also enables you to benchmark your own brand awareness rate against your rivals’.
9. Web Mentions
Of course, just as with social media mentions, website mentions are extremely important. Tracking where you get mentioned and how often brings you lots of useful insights. You can learn:
- How often do you get the media spotlight?
- In what context and what kind of articles does the media publish about you?
- What PR and link-building opportunities are you missing out on?
- Who are the industry experts you need to keep in touch with?
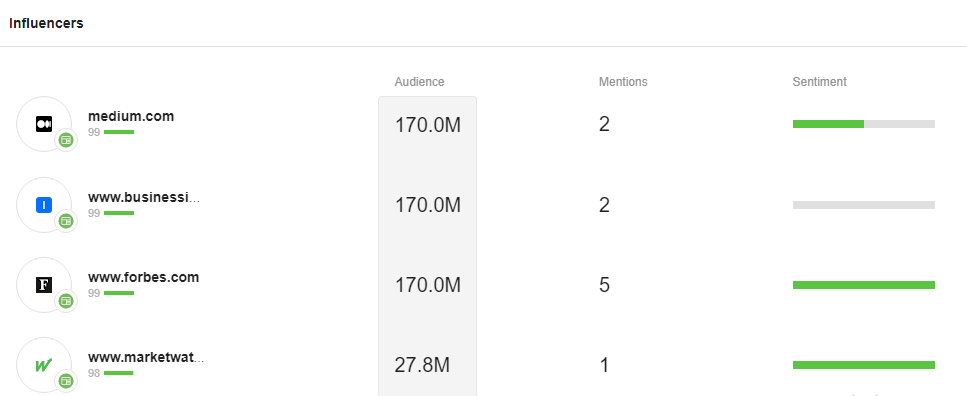
You can easily get the list of all the news outlets which mentioned you ranked by their popularity in Awario.
Click on the Influencers button on the left sidebar. You’ll get a list of websites that mentioned you along with their estimated audience, the number of articles that featured your brand, and the sentiment they expressed.
This data can help you plan out your PR strategy and media interactions.
The Effectiveness of Your Marketing Campaigns
These three metrics are meant to show you how much you put into your marketing and whether these investments are paying off.
10. Cost of Leads and Customer Acquisition Cost
From the name you can guess that cost of leads and customers acquisition cost is similar in the sense that they both are used to calculate how much it costs you to in someone – either a lead or the customer.
Cost of leads refers to the earlier stage of the funnel and shows how successful your marketing strategy is in generating new leads. A lead is an individual that has expressed interest in your product or service by completing a goal, be it committing to a free trial, a demo, or a sign-up for a newsletter.
To calculate the cost per lead you simply need to divide your marketing spendings by the number of leads you acquired. For example, if you spent $1,500 on a paid article from an influencer and got 20 leads, your cost of leads will equal 1,500/20 = $75 per lead.
Cost per Lead = Cost of Generating Leads / Total Leads Acquired
You can probably guess that customer acquisition cost (CAC) is derived in a similar fashion but for new customers that you bring in. You calculate it by taking the total marketing and sales spendings for a particular time period or campaign and then dividing them by the number of customers you acquired during that time. The number is your CAC.
Customer Acquisition Cost = Total Acquisition Cost / Number of Customers Acquired
Both metrics are used to evaluate how effective your marketing is so it’s advisable to calculate them for specific marketing activities, not just for the business as a whole. That way you can spot the tactics that are not cost-effective and change them while doubling down on those that have the desired impact.
11. Return on Marketing Investment
This is every founder’s and CEO’s favorite metric because it shows you how much profit marketing actually brings. If the previous metrics showed how much you spend, the return on marketing investment depicts how much profit your marketing generates.
Here’s the formula to calculate ROMI:
(Sales Growth – Marketing Cost) / Marketing Cost = Marketing ROI
Once again, this metric can be calculated both for your overall marketing strategy and activities or for a specific campaign.
ROI allows you to examine how profitable and successful your marketing strategy is. It is also the metric that can justify relocating or increasing the marketing budget in the eyes of your CEO.
Conclusion
So here’s the list of most important metrics that pretty much got your marketing department (and your business) covered. With them, you’ll be able to make data-supported marketing decisions and see how your brand grows over time.
The secret to marketing analytics is to do it consistently so you have more and more historical data to compare your current metrics with. That’s why once you establish what metrics you want to track, stick to them!


